5.1 Tidying a document-term matrix
A document-term matrix or term-document matrix is a mathematical matrix that describes the frequency of terms that occur in a collection of documents. This is a matrix where
each row represents one document
each column represents one term (word)
each value (typically) contains the number of appearances of that term in that document
Document-term matrices are often stored as a sparse matrix object. These objects can be treated as though they were matrices (for example, accessing particular rows and columns), but are stored in a more efficient format.
tidytext provides ways of converting between these two formats:
tidy()turns a document-term matrix into a tidy data frame (one-token-per-row)cast()turns a tidy data frame into a matrix.There are three variations of this verb corresponding to different classes of matricies :cast_sparse()(converting to a sparse matrix from theMatrixpackage),cast_dtm()(converting to aDocumentTermMatrixobject fromtm), andcast_dfm()(converting to adfmobject from quanteda)
DocumentTermMatrix class is built into the tm package. Notice that this DTM is 99% sparse (99% of document-word pairs are zero).
library(tm)
library(topicmodels)
data("AssociatedPress", package = "topicmodels")

AssociatedPress
#> <<DocumentTermMatrix (documents: 2246, terms: 10473)>>
#> Non-/sparse entries: 302031/23220327
#> Sparsity           : 99%
#> Maximal term length: 18
#> Weighting          : term frequency (tf)
Terms() is a accessor function to extract the full distinct word vector
Terms(AssociatedPress) %>% head()
#> [1] "aaron"      "abandon"    "abandoned"  "abandoning" "abbott"
#> [6] "abboud"
tidy it to get a tidy data frame
# convert to tidy data frames with counts
ap_tidy <- tidy(AssociatedPress)
ap_tidy
#> # A tibble: 302,031 x 3
#>   document term      count
#>      <int> <chr>     <dbl>
#> 1        1 adding        1
#> 2        1 adult         2
#> 3        1 ago           1
#> 4        1 alcohol       1
#> 5        1 allegedly     1
#> 6        1 allen         1
#> # ... with 3.02e+05 more rows
quanteda uses dfm (document-feauture matrix) as a common data structure for text data. For example, the quanteda package comes with a corpus of presidential inauguration speeches, which can be converted to a dfm using the appropriate function.
data("data_corpus_inaugural", package = "quanteda")
quanteda::dfm(data_corpus_inaugural)
#> Document-feature matrix of: 58 documents, 9,360 features (91.8% sparse) and 4 docvars.
#>                  features
#> docs              fellow-citizens  of the senate and house representatives :
#>   1789-Washington               1  71 116      1  48     2               2 1
#>   1793-Washington               0  11  13      0   2     0               0 1
#>   1797-Adams                    3 140 163      1 130     0               2 0
#>   1801-Jefferson                2 104 130      0  81     0               0 1
#>   1805-Jefferson                0 101 143      0  93     0               0 0
#>   1809-Madison                  1  69 104      0  43     0               0 0
#>                  features
#> docs              among vicissitudes
#>   1789-Washington     1            1
#>   1793-Washington     0            0
#>   1797-Adams          4            0
#>   1801-Jefferson      1            0
#>   1805-Jefferson      7            0
#>   1809-Madison        0            0
#> [ reached max_ndoc ... 52 more documents, reached max_nfeat ... 9,350 more features ]
We, of course, want to tidy it
inaugural <- quanteda::dfm(data_corpus_inaugural) %>%
tidy()
inaugural
#> # A tibble: 44,710 x 3
#> document term count
#> <chr> <chr> <dbl>
#> 1 1789-Washington fellow-citizens 1
#> 2 1797-Adams fellow-citizens 3
#> 3 1801-Jefferson fellow-citizens 2
#> 4 1809-Madison fellow-citizens 1
#> 5 1813-Madison fellow-citizens 1
#> 6 1817-Monroe fellow-citizens 5
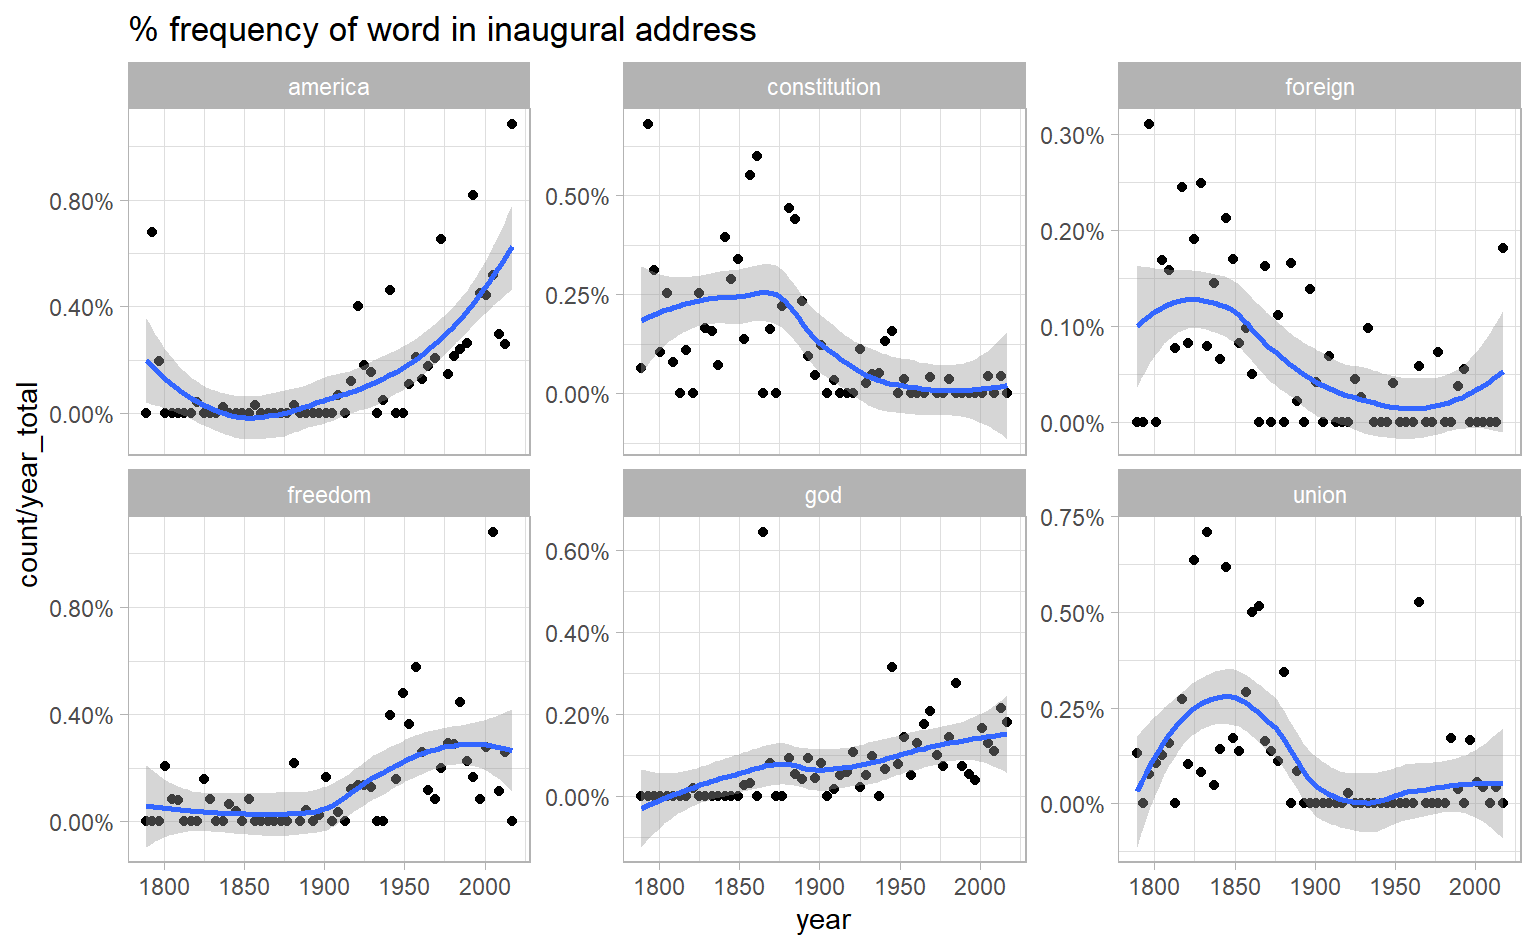
#> # ... with 4.47e+04 more rowsSuppose we would like to see how the usage of some user specified words change over time. We start by complete() the data frame, and then total words per speech:
year_term_counts <- inaugural %>%
  extract(document, into = "year", regex = "(\\d{4})", convert = TRUE) %>%
  complete(year, term, fill = list(count = 0)) %>%
  add_count(year, wt = count, name = "year_total")

year_term_counts
#> # A tibble: 542,880 x 4
#>    year term  count year_total
#>   <int> <chr> <dbl>      <dbl>
#> 1  1789 "'"       0       1537
#> 2  1789 "-"       1       1537
#> 3  1789 "!"       0       1537
#> 4  1789 "\""      2       1537
#> 5  1789 "$"       0       1537
#> 6  1789 "("       1       1537
#> # ... with 5.429e+05 more rows
year_term_counts %>%
filter(term %in% c("god", "america", "foreign", "union", "constitution", "freedom")) %>%
ggplot(aes(year, count / year_total)) +
geom_point() +
geom_smooth() +
facet_wrap(~ term, scales = "free_y") +
scale_y_continuous(labels = scales::percent_format()) +
labs(title = "% frequency of word in inaugural address")