This package is a wrapper around the javascript chart.xkcd library to create xkcd-styled chart for R.
Installation
You can install the development version of xkcd like so:
remotes::install_github("qiushiyan/xkcd")Inspired by echarts4r, a plot is created first by initialization of x_chart, which is appended by functions such as x_line, x_point and x_bar specifying chart type. For example, a line graph of yearly average life expectancy from the gapminder dataset is created as follows
library(xkcd)
library(dplyr)

df <- gapminder::gapminder |>
  filter(country %in% c("United States", "United Kingdom", "Canada", "Australia"))

df |>
  x_chart(title = "my xkcd line graph") |>
  x_line(x = "year", y = "lifeExp", color = "country") |>
  x_options(legend_position = 4)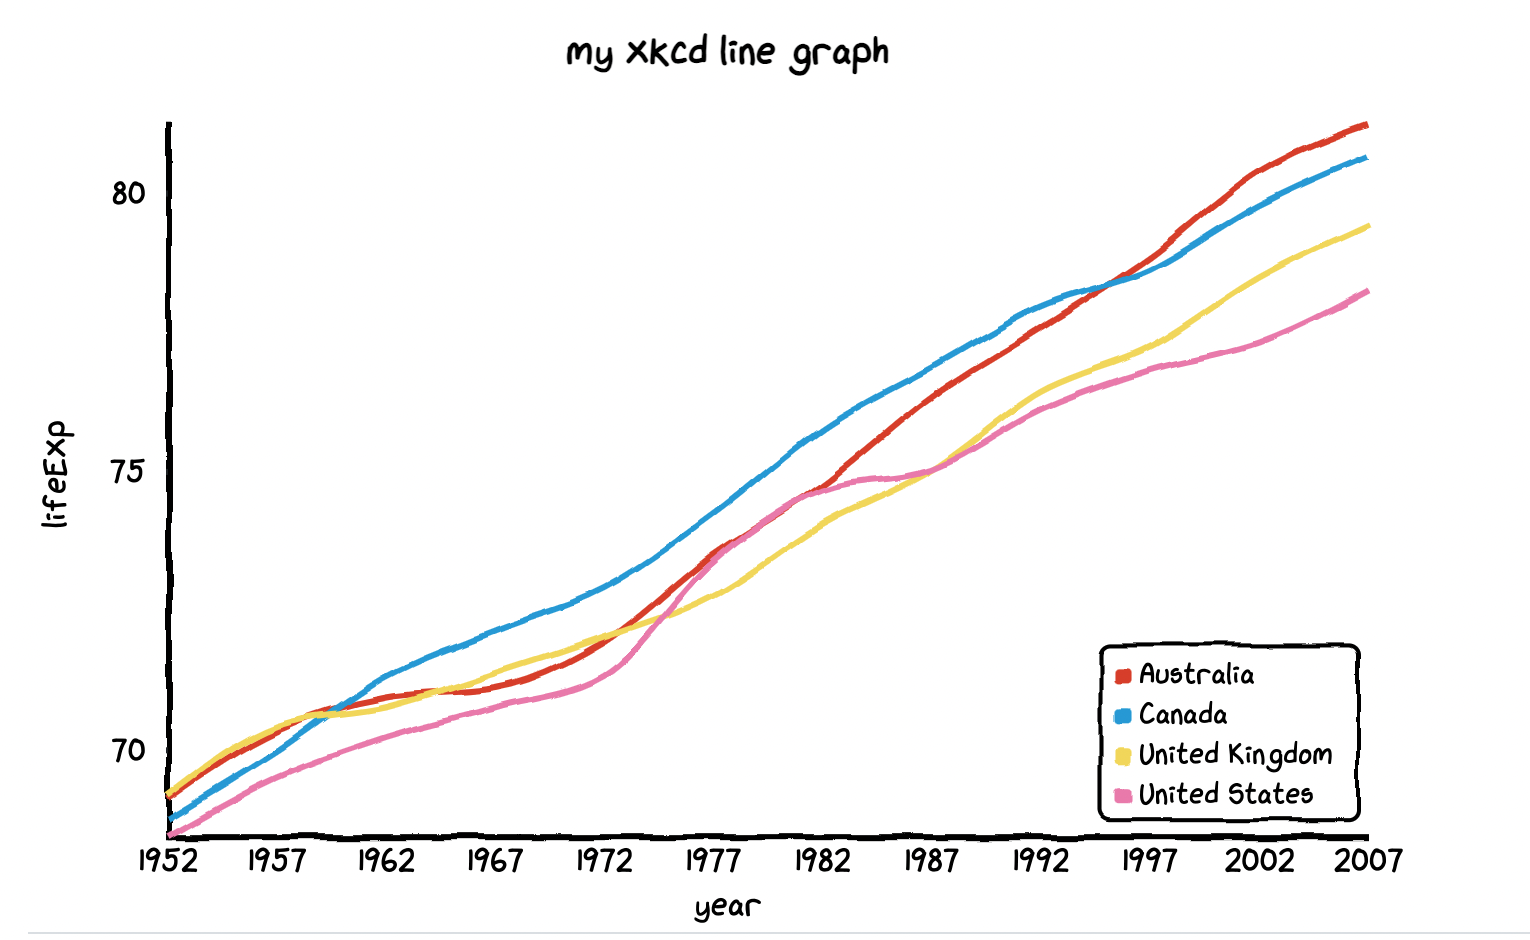
See Getting Started for more examples.