library(nyclodging)
library(tidyr)
library(tidytext)
library(tidytext)
library(widyr)
library(ggraph)
library(dplyr)
words <- listings %>%
  transmute(
    list_id,
    lon,
    lat,
    list_description = stringr::str_to_lower(list_description),
    price
  ) %>%
  unnest_tokens(word, list_description) %>%
  filter(!stringr::str_detect(word, "^[\\d[:punct:]]+$")) %>%
  anti_join(stop_words) %>%
  group_by(word) %>%
  filter(n() > 50) %>%
  ungroup()
Word proportion
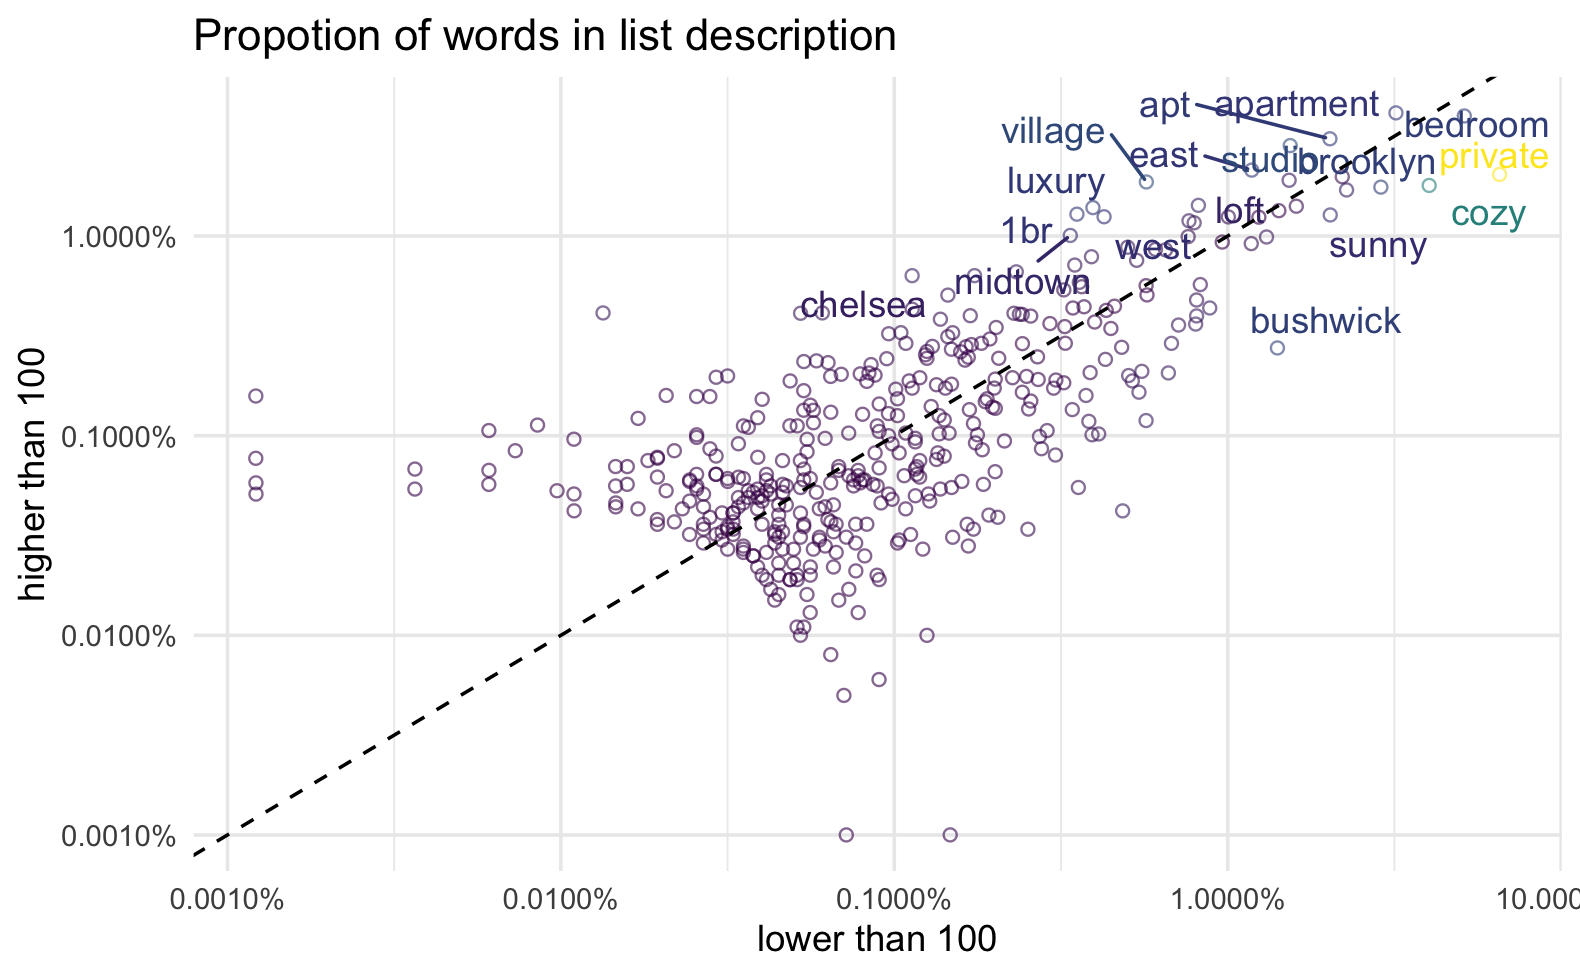
prop_by_price <- words %>%
  mutate(
    price = if_else(price <= 100, "lower than 100", "higher than 100")
  ) %>%
  group_by(price, word) %>%
  count() %>%
  group_by(price) %>%
  mutate(prop = n / sum(n)) %>%
  ungroup() %>%
  pivot_wider(id_cols = word, names_from = price, values_from = prop) %>%
  mutate(diff = `higher than 100` - `lower than 100`)
prop_by_price %>%
  ggplot(aes(`lower than 100`, `higher than 100`, color = abs(diff))) +
  geom_jitter(shape = 21, alpha = 0.6) +
  ggrepel::geom_text_repel(aes(label = word),
                            data = . %>% filter(abs(diff) >= 0.005)) +
  scale_x_log10(label = scales::label_percent()) +
  scale_y_log10(label = scales::label_percent()) +
  scale_color_viridis_c(breaks = scales::breaks_log(), guide = "none") +
  geom_abline(slope = 1, intercept = 0, linetype= "dashed") +
  theme_minimal() +
  theme(panel.grid.minor.y = element_blank()) +
  labs(
    title = "Propotion of words in list description"
  )

Word Correlations
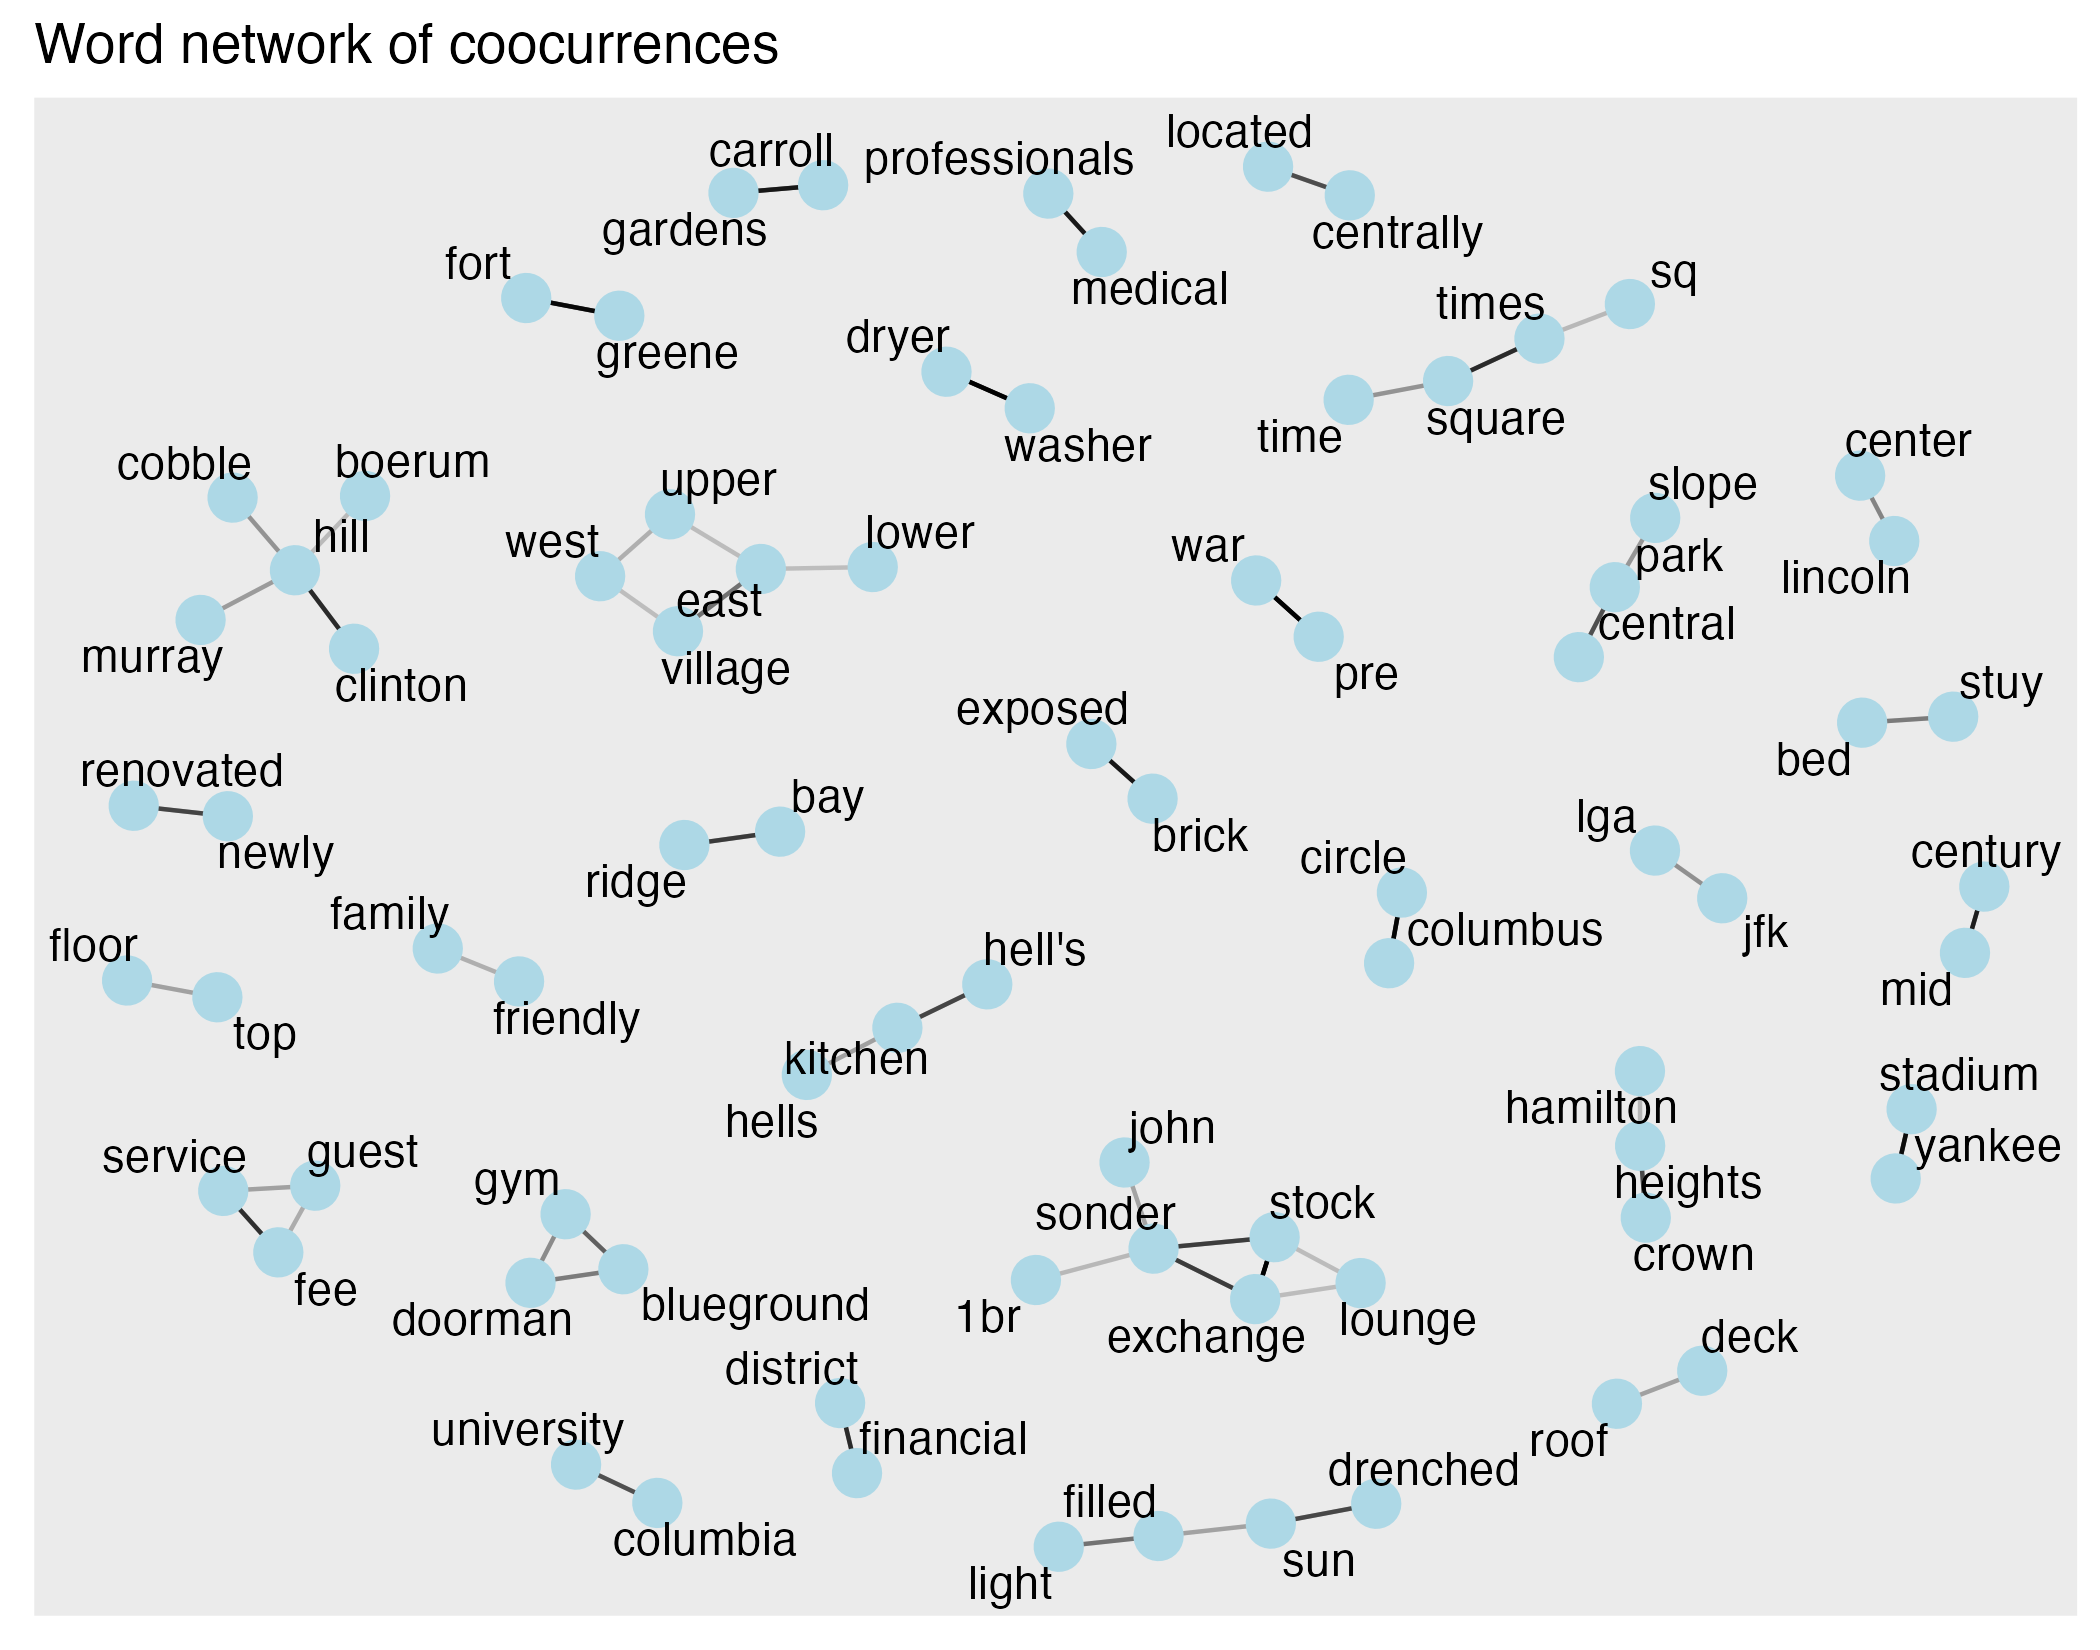
words %>%
  pairwise_cor(word, list_id) %>%
  filter(correlation >= 0.3) %>%
  tidygraph::as_tbl_graph() %>%
  ggraph(layout = "fr") +
  geom_edge_link(aes(edge_alpha = correlation), show.legend = FALSE) +
  geom_node_point(color = "lightblue", size = 5) +
  geom_node_text(aes(label = name), repel = TRUE) +
  labs(title = "Word network of coocurrences")